Cost Governance for LLM Applications
How to track and control costs for LLM pipelines and applications

Most teams confuse cost visibility with cost governance.
Seeing a sudden $15,000 spike on a line-item graph is visibility. Preventing a rogue agent loop from spending $15,000 in twenty minutes while you sleep is governance. Confusing the two is how a $2,000/month pilot turns into an eye-watering invoice that ruins your quarter.
When I finished building the tracing, evals, guardrails, and prompt versioning for an end-to-end LLMOps pipeline, cost was the final item marked “we’ll figure it out later.”
Here is what actually “figuring it out” looks like in production.
The Default Trapping: One Line Item, Zero Context
By default, managed platforms like AWS Bedrock bill LLM usage as a single consolidated line item. You watch the total cost climb, but you can’t answer critical post-mortem questions:
- Which engineering team owns this burst?
- Which specific agent script spiraled into an infinite retry loop?
- Which bad prompt template inflated our token counts?
Solving this is the key task. Every optimization effort before attribution is just uneducated guessing.
The 4-Layer LLM Governance Framework
To move from passive monitoring to active governance, implement these four layers sequentially.
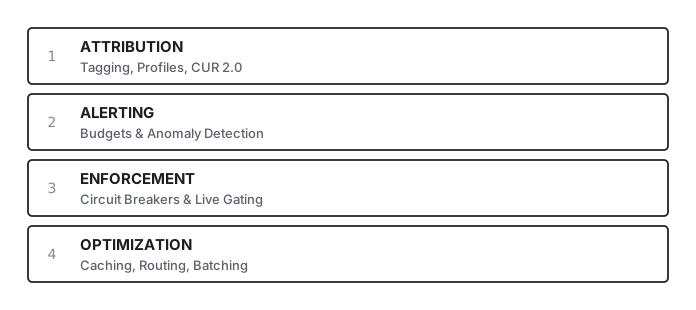
Layer 1: Granular Attribution
- Application Inference Profiles (AIPs): Wrap Bedrock model ARNs inside tagged profiles. Route calls through these ARNs so metadata automatically flows to AWS Cost Explorer and Cost & Usage Reports (CUR). Tag by team or cost center—never per user (it won’t scale).
- IAM Principal Allocation: Enable caller identity data in CUR 2.0 to allocate costs directly to IAM roles and users without building custom middleware.
- Per-Request Metadata: For sub-penny telemetry (like prompt/completion token ratios), pass a
requestMetadatapayload containing yourtenantIdoruserIdand query it via CloudWatch Logs Insights.
Layer 2: Proactive Alerting
Avoid single, org-wide budget caps—nobody takes ownership of them. Set project-level budgets using AWS Budgets paired with Cost Anomaly Detection.
Remember: An alert only tells you that damage has occurred. It does not stop the bleed.
Layer 3: Hard Enforcement (The Missing Layer)
This is the step most engineering teams skip until their first billing incident. An runaway loop burns thousands of dollars in minutes, long before your CloudWatch alarm evaluates or an email alert triggers.
Enforcement requires an in-path check. Run a lightweight proxy or API middleware backed by a fast state store (like Redis) that evaluates live token/dollar spend and active-gates incoming requests before they hit the upstream model provider.
Layer 4: Tactical Optimization
Once you know who is spending and where, apply the levers that actually impact the bottom line:
- Context & Prompt Caching: Cache static system prompts and static RAG context blocks.
- Dynamic Model Routing: Route simple sub-tasks (classification, extraction, rewrites) to lighter, cheaper models.
- Batch Inference: Offload non-real-time jobs to async batch endpoints for ~50% cost reductions.
- Provisioned Throughput: Commit to dedicated capacity only after baseline usage stabilizes.
Centralized Governance Gateways: Native vs. Proxy
AWS-native tools work well within a single ecosystem. But the moment your application makes calls across OpenAI, Anthropic, and Bedrock, native tagging falls apart.
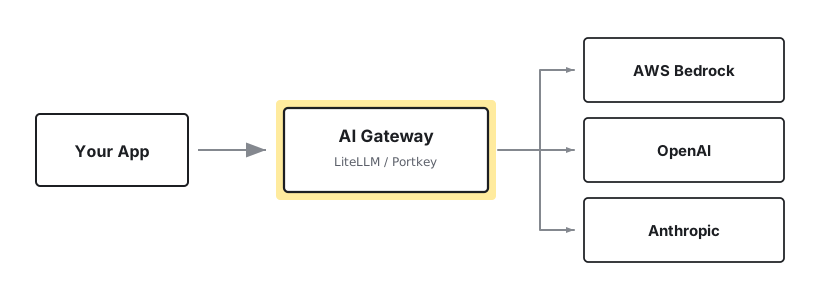
You need a centralized Governance Gateway in front of your invocation pipeline.
Choosing Your Control Plane
- AWS-Native Only (AIPs + CUR 2.0): Best if you are single-cloud, have modest scale, and don’t want to maintain additional infrastructure proxy layers.
- AWS-Native + LiteLLM / Portkey: Stay entirely on Bedrock infrastructure, but deploy an open-source gateway (LiteLLM) or managed control plane (Portkey) in front of it to gain fallbacks, prompt caching, and dynamic routing logic.
- Multi-Provider Proxy (LiteLLM / Portkey / Helicone): Standardize all outgoing calls across multiple providers behind a single OpenAI-compatible interface.
Rule of thumb: Place a governance gateway in front of your LLM calls before integrating a second model provider. Refactoring call sites after going multi-provider is painful and prone to governance leaks.
Production Readiness Checklist
Before marking your LLMOps cost governance task as “Done,” verify these items:
- Every model invocation maps to a defined team, service, or project.
- Project-level budgets are set with automated anomaly detection alerts.
- In-path enforcement (circuit breakers/rate limits) exists for volatile workloads.
- At least one optimization lever (caching, routing, or batching) is active in production.
- Model and vector store pricing assumptions are updated against current rates.
- A proxy/gateway layer is architecture-ready before multi-provider expansion.
The Takeaway
Cost dashboards are popular because they are easy to deploy. But visibility only tells you how much money you’ve already lost.
True governance should be structural: hard gates, real-time attribution, and dynamic routing that protect your infrastructure budgets automatically. Build visibility first, but just don’t stop there.